Tools menu
The Tools menu holds the windows for looking into the machine and changing it, and the settings. The right-click menu over the picture has the same windows under Tools, and Options… at its foot.
 Cheats… - trainers and pokes for the program that runs; see
Cheats.
 Debugger - stops the machine and shows what is inside it; see
Debugger.
 Watcher - registers and memory, followed while the machine runs; see
Watcher.
 Screen and
 Sound Chips - two panels of the Debugger in
windows of their own, described below.
 Heat Map - the Debugger’s heat map in a window of its own; see
Heat Map window.
 Options… - the settings; see Options. On macOS it is
Settings… in the application menu.
Screen and Sound Chips windows
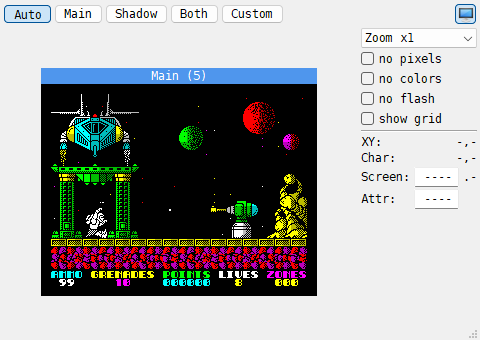
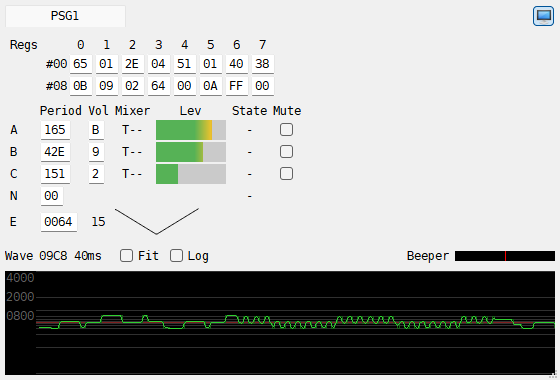
Tools > Screen and Tools > Sound Chips move the Screen and Sound Chip panels out of the Debugger into windows of their own. The same command again puts the panel back. In the Classic preset the keys are Alt+S and Alt+A; the Modern preset has no keys for them.
The button at the top right of each panel,  Show in its own window, does
the same. In the window it is pressed in; click it again, or close the window, to put the
panel back in the Debugger. While the panel is out, its tab in the Debugger says so, with a
Bring it back or Bring them back button.
The windows work without the Debugger: they follow the machine while the machine runs, one picture a frame (in fast mode, one in ten frames). The settings are the same as in the panel. Each window keeps its place and size, and a window that was open when you quit opens again at the next start.