DUMP panel
The Debugger shows memory byte by byte in the DUMP panel, and the bytes the registers point at in REG-DUMP. The tools around them find bytes, fill memory, show it as pictures, save it to a file and load it back. Which memory pages the CPU sees is in the MEMMAP panel, and which memory the program uses and how in the Heat map panel.
The DUMP panel
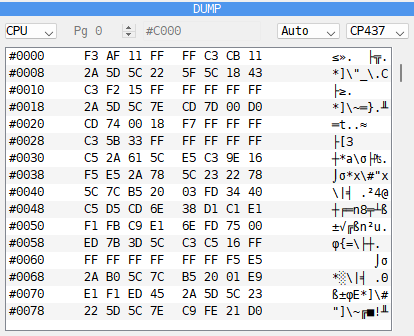
View - CPU, RAM, ROM or DIV, and for the last three the page and its address.
Bytes per row - Auto, 8/row, 12/row or 16/row.
Code page - CP437 (the default), CP1251, CP866 or KOI8-R: how bytes from 128 to 255 show in the text column. CP437 is the IBM PC’s own, with accented letters and box drawing; the other three have Cyrillic letters.
Dump - the address, the bytes in groups of four, and the same bytes as text.
Scrollbar - drag it to move through memory.
The title of the panel shows the address of the byte under the cursor: DUMP | #C000. The addresses are in the form picked for the Debugger: see Hex or decimal.
In the text column a byte below 32, and 127, shows as a dot. Auto puts as many groups of four bytes on a row as the panel is wide enough for.
Rest the mouse on a byte, here or in REG-DUMP, for its address and label, its value in hex, decimal and binary, and the word read from it (see Typing a number).
Moving around
Key |
What it does |
|---|---|
Up, Down |
move the cursor one row; at the edge the dump scrolls by one row |
PageUp, PageDown |
scroll one page up or down |
mouse wheel |
scroll by one row |
These keys can be changed on the Hotkeys page of Options; the two presets differ only in Go to address, which the Modern preset also gives Ctrl+G (see Debugger keys):
Command |
Key |
Goes to |
|---|---|---|
Go to address |
G (Modern: also Ctrl+G) |
the address cell of the top row opens for typing |
Go to (PC) |
Ctrl+P |
the address in PC |
Go to (SP) |
Ctrl+S |
the top of the stack |
Go to (BC) |
Ctrl+B |
the address in BC |
Go to (DE) |
Ctrl+D |
the address in DE |
Go to (HL) |
Ctrl+H |
the address in HL |
Go to (IX) |
Ctrl+X |
the address in IX |
Go to (IY) |
Ctrl+Y |
the address in IY |
A right-click on a register’s name in the CPU panel moves the dump to the address the register holds.
To go to an address, double-click the address of any row, or select it and press Enter, and
type the address to go to. The dump scrolls so that the address lands on that row. An
address can be a number - hex with a sign, #8000, $8000, 0x8000 or 8000h, or
decimal without one, 32768 (see Typing a number) -
a label, or a register with a dot in front, as .HL. The labels are offered as you type, as in the listing (see
Labels offered as you type).
Editing
Double-click a byte, or select it and press Enter, and type the new value: two hex digits. Enter writes it. The text column cannot be edited.
The new value goes into the byte the dump shows. RAM is always written. Memory the machine
itself cannot write is protected: ROM, divMMC’s ROM and its page 3 under MAPRAM, and on the
Next its alternate ROM and the Multiface’s ROM. Such a byte is written only with
Allow ROM wr ticked in the  Options menu of the Disasm panel. A
cartridge is never written.
CPU, RAM, ROM and DIV
CPU shows the 64K the CPU sees now, with whatever pages are in it. RAM and ROM show one whole 16K page, whether the CPU sees it or not. On the ZX Spectrum Next a RAM page is 8K and ROM has its four ROMs, numbered as in the MEMMAP panel and in labels.
Pg - the number of the page, up to the last one the machine has;
the address field - the address the first byte of the page is shown at. Switching the view sets it to C000 for RAM and 0000 for ROM.
The rows then show the page and the address, as 07:C000.
DIV shows one 8K page of a divMMC’s RAM, whether it is paged in or not; on a Next, the divMMC RAM it has inside. Pg counts the board’s pages, the address starts at 2000, where the board pages them in.
Selecting and breakpoints
Bytes are selected the way text is in an editor, in the bytes and in the text column alike:
a click puts the cursor on a byte and clears the selection; on an address it puts the cursor there, for Enter to type another address;
drag from a byte to select up to the byte under the mouse; past the top or the bottom of the panel the dump scrolls on;
Shift+click selects from where the selection started, or from the cursor, to the byte clicked; Shift with the arrow keys, Page Up and Page Down does the same from the keyboard;
a click with the middle button clears the selection.
In the CPU view the DUMP and the Disasm listing share one selection, so a block selected here is ready for View, Fill… and the other block commands of the listing (see Selecting a block). A RAM, ROM or DIV view keeps a selection of its own, shown on that page. Save dump opens on the selection of the view on show.
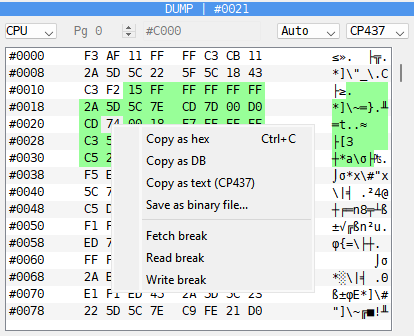
A right-click opens a menu. A click inside the selection keeps it; elsewhere it moves the cursor there and clears the selection.
Copy as hex (Ctrl+C) - the selected bytes in one line,
3E 01 D3 FE, in hex whatever the Debugger shows. A hex editor pastes it as bytes.Copy as DB - the bytes as assembler source, a
DBline for each row of the dump the selection covers, the numbers written as the Debugger writes them:DB #3E,#01,DB 0FEh,DB 254.Copy as text - the bytes as the text column shows them, in the code page it names, as Copy as text (CP866); a control code is a dot. For a message in a program, to read it or look it up.
Save as binary file… - writes the selected bytes to a file. Its name is made of the image in use, the page and the addresses, as
exolon_C000-C3FF.binorexolon_RAM5_C000-C3FF.bin; the folder is the one the last file went to, at first the image’s.Fetch break, Read break and Write break - tick one to stop the machine when the CPU runs, reads or writes the byte under the cursor. See Breakpoints panel.
The FMAPS window on TSConf
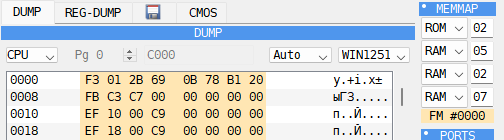
On the ZX Evolution (TSConf), while port 15AF (FMAddr) has the FMAPS window on,
the CPU view draws its bytes in the FMAPS color. The dump shows what is in the bank
there, since a read never reaches the window; a write by the program goes to the bank and
also to the palette, the sprite descriptors or a TSConf register. Hold the mouse over a
byte to see which: FMAPS: CRAM, color #02, FMAPS: SFILE, sprite 3,
FMAPS: port #15AF. The MEMMAP row FM says where the window is: see
MEMMAP panel.
REG-DUMP
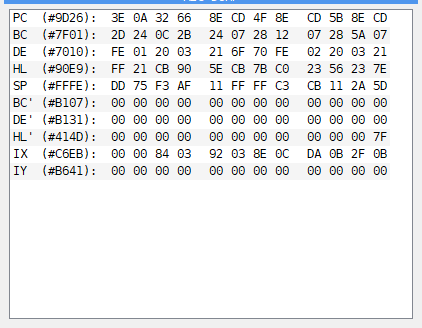
REG-DUMP shares a place with the DUMP: click its tab. It has a row for each
register that can point into memory - PC, BC, DE, HL, SP, BC’, DE’, HL’, IX and IY. Each
row starts with the register and its value, HL (5CB0):, and goes on with the bytes from
that address, as many as fit. It changes with every step, so you see at once what an
instruction is about to read. It cannot be edited.
Memory Finder
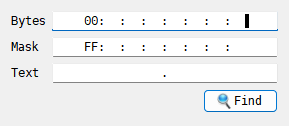
Search in the  Tools menu of the Disasm panel opens the
Memory Finder, as does the Find pattern key: Ctrl+F in both presets.
Bytes - up to 8 bytes in hex, separated by colons:
3E:05:C9.Mask - for each byte, the bits that must match:
FFall of them,00none, so that any byte will do there,0Fonly the low four bits. Bytes with no mask must match whole.Text - up to 8 characters. Typing text fills Bytes with its codes, and typing bytes shows them here as text. The case of the letters matters.
 Find goes through the 64K the CPU sees, starting from the address at the
top of the listing. The line under the fields says Found @ and the address, or
Not found. The listing and the DUMP go to the place found.
Memory Filler
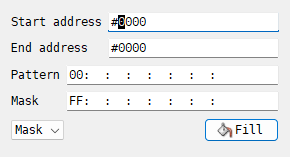
Fill… in the Tools menu opens the Memory Filler. With a block
selected, the window opens with the block’s start and end filled in.
Start address, End address - the memory to fill, ends included.
Pattern - up to 8 bytes, separated by colons. The pattern repeats up to the end address.
Mask - used by the Mask method only: the bits of each byte that the pattern sets.
The method, how the pattern is written:
Method |
Each byte becomes |
|---|---|
Mask |
the pattern in the bits of the mask, the old byte in the rest |
Put |
the pattern |
Or |
the old byte OR the pattern |
And |
the old byte AND the pattern |
Xor |
the old byte XOR the pattern |
 Fill writes the memory the CPU sees and closes the window. ROM is written
only with Allow ROM wr ticked.
Memory Sprite Scanner
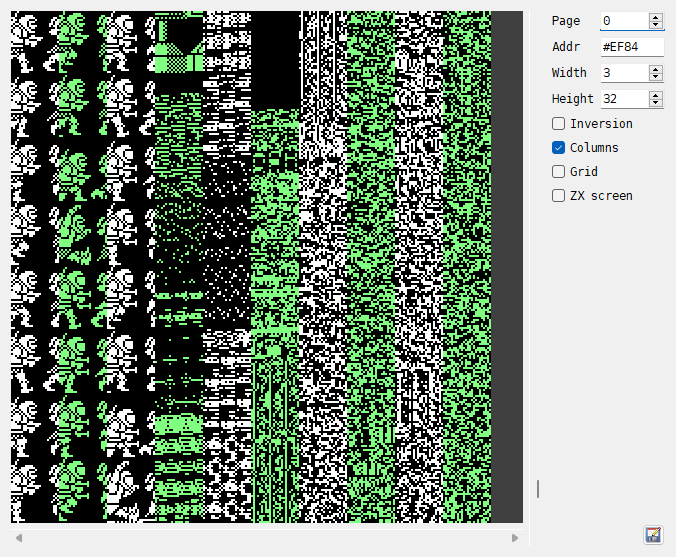
Sprite scanner in the Tools menu opens the Memory Sprite Scanner.
The scanner shows memory as a picture, one bit a pixel, so that sprites, fonts and screens
can be found by eye. The picture here shows Exolon (Raffaele Cecco, Hewson, 1987): with
Width 3, the frames of the running hero stand one under another, and Columns draws
the memory that follows them in more columns side by side.
Page - the RAM page read for the addresses from C000 to FFFF. At first it is the page the CPU has there.
Addr - the first byte shown.
Width - how many bytes make one line of the picture, 8 pixels each.
Height - how many rows of 8 lines the picture has.
Inversion - swaps black and white.
Columns - when Width is narrow, the memory that follows is drawn in more columns side by side, every second column in green, to fill the picture.
Grid - shades every other 8 x 8 square, to see where the bytes and rows fall.
ZX screen - reads the memory the way the ZX screen lays it out: 6144 bytes from Addr.
The scrollbar at the right and the mouse wheel move the address by one row of 8 lines.
The  button with the floppy and pencil saves the bytes shown - Width x
Height x 8 of them, or 6144 with ZX screen - to a file, as they are in memory.
The scanner window hides when you close the Debugger, and opens again with the Debugger.
Saving and loading memory
Save dump and Load dump are in the  floppy disk menu at the right of
the Disasm toolbar. Each has a key of its own: see
Debugger keys.
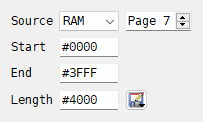
Save Memory Dump saves a part of memory to a file. Source says which memory:
CPU - the 64K the CPU sees now, with whatever pages are in it;
the memory the machine has, whether the CPU sees it now or not: RAM, ROM, and where the machine has them Alt ROM, divMMC ROM, divMMC RAM, Multiface ROM, Multiface RAM and Cartridge. Page picks the page; the list’s tooltip says how big the pages are and how many there are. On a Next, RAM is counted in its own 8K pages.
The window opens on what the DUMP panel shows: CPU, or the RAM, ROM or DIV page it is on.
Fill in Start and End, or Start and Length, in the Debugger’s numbers (see
Hex or decimal): the third field is filled in by itself. With CPU they are addresses. With any other source they count
from the start of the page, and may run on into the pages after it, up to the end of that
memory. Picking another source sets them to one whole page; Page 0 with
Length 20000 saves all the RAM of a 128K. Then pick from Save as…:
…as bin - the bytes as they are, into a file you name;
…as Hobeta - a
.$Cfile: a TR-DOS code file. From CPU it is named after the start address and loads back to it. From a page it is named after the page -RAM7,ROM1,DIV3, with the start after a+if it is not 0 and the name has room - and loads where the CPU sees that page: C000 for RAM, 0000 for ROM, 2000 for divMMC RAM;…to disk A to …to disk D - a code file on the TR-DOS disk in that drive, named and placed the same way. A drive with no disk gets a new, formatted one. A file saved this way can be up to FF00 bytes long.
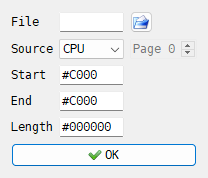
Open Memory Dump loads a file into memory. The  button beside File
picks the file. Source and Page say which memory it goes into, as when saving.
Start is where the file is loaded - C000 at first for CPU, the start of the page
for the rest - and Length and End show how far the file reaches. A file that would
run past the end of the memory is moved down to end there; one too long for it at all is
not loaded. Into CPU a file can be up to FF00 bytes long.
 OK
writes the file; ROM, divMMC ROM, Alt ROM, Multiface ROM and a cartridge only with
Allow ROM wr ticked.
Example: find where the score is kept
Play the game until the score shows a number you can recognize, such as 150.
Open the Debugger: Tools > Debugger.
Open the Memory Finder (Tools > Search). Many games keep the score as digits: type the digits in Text as the game shows them, leading zeros included, such as
000150. Click Find.Found @ gives the address, and the DUMP shows the digits there.
To check it, change a digit in the DUMP -
31to39turns a 1 into a 9 - and close the Debugger. The next time the game draws its score, it shows the change.
If the text is not found, the game keeps the score in another form. Try the number as
bytes: 01:50 for 150 kept as decimal digits two to a byte, or 96:00 for 150 as a word,
low byte first. To find the code that adds the points, put a Write break on the score
(see Breakpoints panel).
Example: save the screen memory to a file
Open the Debugger: Tools > Debugger.
In the
floppy disk menu of the Disasm toolbar, choose Save dump.Pick CPU in Source. Type
4000in Start and1B00in Length. End shows5AFF.Click
Save as… and choose …as bin. Name the file, such as
picture.scr.
The file holds the 6912 bytes of the screen, the picture and then its colors, in the same
layout as a .scr screenshot (see Capture menu).
The second screen of a 128K is in RAM page 7. To save it, pick RAM in Source and 7
in Page, then type 0000 in Start and 1B00 in Length.