Debugger
The Debugger stops the machine and shows what is inside it: the program as Z80 code, the CPU registers, the memory, the stack and the state of the devices. From there you run the program one instruction at a time, change registers and memory, and set breakpoints that stop the machine where you want it.
This page is about the window, opening and closing it, and running and stepping. Each panel has a page of its own, listed at the end of The panels.
The window
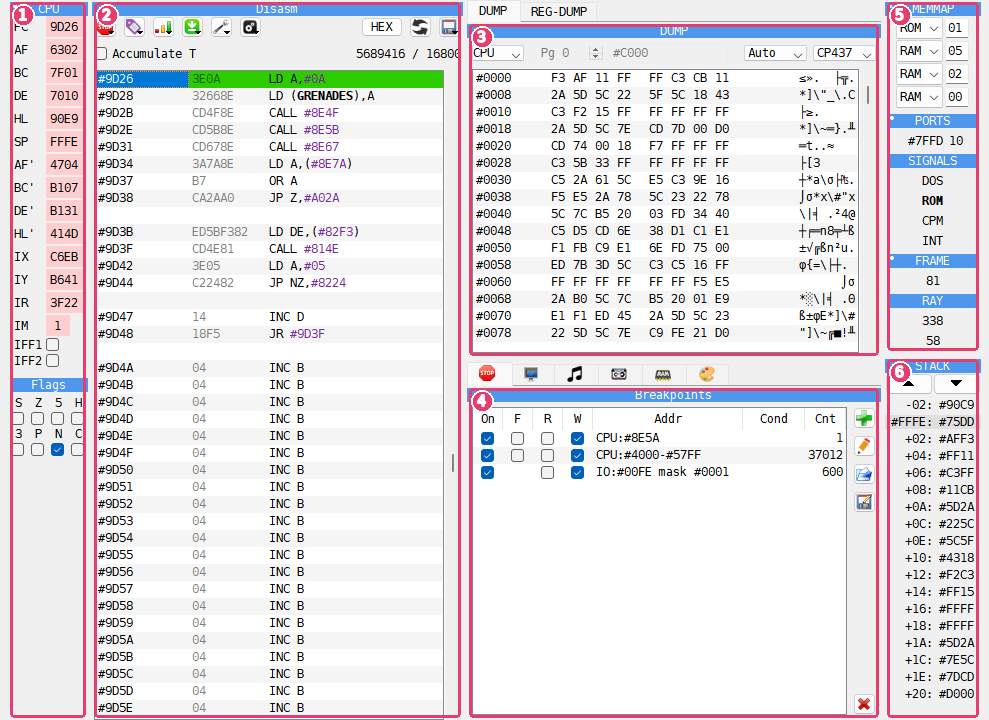
CPU - the registers and flags. See CPU panel.
Disasm - the program as code, with the Debugger’s buttons and the T-state counter above it. See Disasm panel.
DUMP - memory as bytes, with REG-DUMP, FDD and CMOS on tabs behind it.
Breakpoints - the list of breakpoints, with Screen, Sound Chip, Tape, FDC, Heat map and Palette on tabs behind it. On a ZX Evolution, ZX Evo is there in place of Palette.
MEMMAP - the memory banks, the watched ports and the state of the machine. See MEMMAP panel.
STACK - the words on the stack. See STACK panel.
Most pictures of the Debugger chapters show it stopped in a game, Exolon (Raffaele Cecco, Hewson, 1987), with three labels and three breakpoints set for it.
The window title is Xpeccy+ Debugger. The Debugger keeps its own position and size, and its own font, set on the Debugger page of Options.
Opening and closing
Open the Debugger in any of these ways:
Tools > Debugger, or the
 Debugger button on the toolbar;
Debugger in the menu that a right-click on the picture opens;
the Debugger hotkey: F10 (Modern), Esc (Classic);
-don the command line opens it as soon as the program starts (see Command line);a breakpoint opens it by itself when the machine reaches it (see Breakpoints panel), unless DeZog is connected.
While the Debugger is open, the machine stands still. There is no sound, fast mode is switched off, and keys pressed in the main window do not reach the machine. The picture in the main window shows the frame as far as the machine had drawn it; the part not drawn yet shows the previous frame, darkened. A click on the main window brings the Debugger back to the front.
To let the machine run on, close the Debugger: press Esc, press the Debugger hotkey again, or close the window. The machine goes on from the instruction the Debugger shows. That instruction runs first even if a breakpoint is on it, so the machine does not stop on the same place again at once.
The panels
Every part of the window is a panel that can be moved. Panels that share a place are tabs: click a tab to bring its panel to the front. Some tabs show only an icon; the name of the panel in front is in its title bar.
Panel |
What it shows |
Explained in |
|---|---|---|
CPU |
the CPU registers and flags |
|
Disasm |
the program as code |
|
DUMP |
memory as bytes and text |
|
REG-DUMP |
the memory the registers point at |
|
CMOS |
the clock chip’s memory |
|
Heat map |
how often each memory cell is read, written and run |
|
Breakpoints |
the breakpoints |
|
Screen |
a ZX screen drawn from memory |
|
Sound Chip |
the registers of the sound chips |
|
Tape |
the tape’s state and the signals in and out |
|
FDC |
the floppy disk controller and the drive |
|
FDD |
the bytes on a track of a floppy disk |
|
Palette |
the colors of the machine’s palette |
|
ZX Evo |
the video and memory hardware of a ZX Evolution |
|
ZX Next |
the registers, sprites, copper, layers and DMA of a ZX Spectrum Next |
|
MEMMAP |
the memory banks, ports and signals |
|
STACK |
the words on the stack |
CMOS is there only on machines that have a clock chip: the ZX Evolution with BaseConf or TSConf, the Pentagon 1024, the Profi v5, and any machine with a SMUC. FDC and FDD are there only on a machine with a disk interface. ZX Evo is there only on a ZX Evolution, with TSConf or BaseConf, and Palette on every other machine. ZX Next is there only on a ZX Spectrum Next.
Screen, Sound Chip and Heat map can also be windows of their own: Tools >
Screen, Tools > Sound Chips and Tools > Heat Map open them, and they work while
the machine runs. ZX Evo and
ZX Next can be too, from the  button at the top right of the panel. See
Device panels.
Arranging the panels
Drag a panel by its title bar and drop it where you want it: beside another panel, above or below it, or onto it to put the two panels on tabs. Drop it at the far left or far right edge of the window to give it a column of its own. Drag the line between two panels to share the room differently.
A panel cannot be closed, and it cannot leave the window.
The arrangement is kept: the next time the Debugger opens, and the next time the program
starts. To get the arrangement it ships with, choose Reset panel layout from the
 Options button over the listing. This command also brings the window
back to its original size.
Device panels
Besides the CPU and the memory, the Debugger shows the state of the machine’s devices: the screen, the sound chips, the tape, the floppy disk controller, the clock chip and the palette, and on a ZX Evolution or a ZX Spectrum Next its video hardware. Each is a panel of its own, on a tab beside Breakpoints or DUMP. Like every panel, they show the state the machine stopped in and change with each step.
The Screen and Sound Chip panels can also be windows of their own that work while the machine runs: see Screen and Sound Chips windows. So can the ZX Evo and ZX Next panels: see The ZX Evolution window.
Panel |
Shown on |
Use it to |
|---|---|---|
Screen |
every machine |
see a screen in memory and find the address of a dot |
Sound Chip |
every machine |
read and change the registers of the AY and YM chips |
Tape |
every machine |
see the tape signal around the current position |
FDC |
a machine with a disk interface |
see the registers of the disk controller and the drive |
FDD |
a machine with a disk interface |
read the raw bytes of a disk track |
CMOS |
a machine with a clock chip |
read and change the memory of the clock chip |
Palette |
every machine but the ZX Evolution |
see the colors of the machine’s palette |
ZX Evo |
a ZX Evolution, with TSConf or BaseConf |
see what its video and memory hardware is set to, and hide TSConf layers |
ZX Next |
a ZX Spectrum Next |
see its registers, sprites, copper, layers, tilemap, palettes and DMA |
ZX Evo and ZX Next are made for one machine each. On a ZX Evolution, ZX Evo takes the place of Palette and has a Palette tab of its own; on the Next, Palette stays beside ZX Next.
The pages of the panels
The rest of this part of the manual has a page for each panel, and one for the Watcher window:
The buttons over the listing
A row of buttons above the Disasm panel holds the Debugger’s menus. Hold the mouse over a button to see its name. The menus that belong to the listing are described in full in The toolbar.

Button |
What is in it |
|---|---|
|
Fetch break, Read break, Write break on the line or block - see Breakpoints panel |
|
show, load, save and list labels - see Disasm panel |
|
show the lines as Opcode, Byte, ASCII, Word or Address - see Disasm panel |
|
the kinds of trace - see Trace |
|
Search, Fill…, Sprite scanner (DUMP panel), Keyboard (the Virtual Keyboard), Watcher (Breakpoints panel) |
|
how the listing looks, writing to ROM, runtime mapping (Disasm panel), and Reset panel layout |
|
opens the last file again and its labels, as File > Reload does |
|
Disasm to file, Load dump, Save dump, Load map, Save map - see Disasm panel and DUMP panel |
 Breakpoints
 Labels
 View
 Tools
 Reload snapshot & labels
 (disk)
Running and stepping
These keys work while the Debugger has the focus. The Hotkeys page of Options lists them under Debugger, and changes them there (see Hotkeys page).
Action |
Modern |
Classic |
What it does |
|---|---|---|---|
Step in |
F7 |
F7 |
runs one instruction |
Step over |
F8 |
F8 |
runs one instruction; a call or a loop runs to its end |
Step out |
Shift+F8 |
F6 |
runs until the current subroutine returns |
Fast step |
Alt+F7 |
Alt+F7 |
runs ten instructions |
Stop here |
F4 |
F9 |
runs until the line under the cursor |
Trace |
Ctrl+T |
Ctrl+T |
runs instruction by instruction until you press a key |
Close |
Esc |
Esc |
closes the Debugger and lets the machine run |
After each step every panel shows the new state, and the registers that changed are marked.
Step in runs the instruction at PC, the line marked in the listing. Hold the key down to keep stepping: the Debugger traces, as with Trace, until you release the key.
Step over runs some instructions to their end in one step: CALL, RST, DJNZ, HALT and the repeating block instructions LDIR, LDDR, CPIR, CPDR, INIR, INDR, OTIR and OTDR. The Debugger closes, the machine runs at full speed until it reaches the instruction that follows in memory, and the Debugger opens again there. Any other instruction is one step, as with Step in.
Step out lets the machine run until the subroutine it is in returns. Calls and interrupts made on the way are counted, so only the RET that ends this subroutine stops the machine. The Debugger opens after that RET.
Stop here runs the machine at full speed until PC reaches the line the cursor is on in the listing. Click the line first, so the listing has the focus.
Step over, Step out and Stop here let the machine run with the Debugger closed. If a breakpoint stops the machine first, or you open the Debugger yourself, the place where the machine was to stop is forgotten. If the program never gets there, the machine just runs on.
While you step or trace, breakpoints are not checked. They work again once the machine runs with the Debugger closed, from the instruction at PC: a read, a write or a port it uses can stop the machine at once, and the Debugger then stays open after that instruction. So Step out with PC on the RET itself stops after that RET.
Trace
Trace runs the program one instruction after another, and the panels show each step as it happens. Press any key to stop it. Trace is much slower than the machine at full speed.
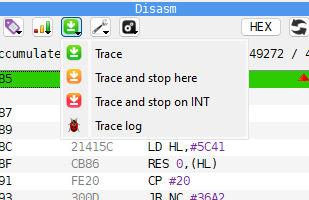
The  Trace button over the listing holds four kinds of trace:
Trace - until you press a key;
Trace and stop here - until PC reaches the line the cursor is on. It is also in the menu that a right-click on the listing opens;
Trace and stop on INT - until an interrupt comes that the CPU will take;
Trace log - asks for a file name, then traces until you press a key and writes one line per instruction into the file.
The first line of a trace log names the columns. On a Z80 it reads:
addr|command|PC|AF|BC|DE|HL|SP|AF'|BC'|DE'|HL'|IX|IY|IR|IM|IFF1|IFF2
Each following line is one instruction: its address, the instruction itself, and the
registers after it ran, in hex. The columns are separated by |, and the numbers are in
quotes so that a spreadsheet keeps them as text: open the file there with | as the
separator.
The T-state counter
Above the listing, on the right, are two numbers:
the left one is the number of T-states the last step took. After the machine ran with the Debugger closed - Step over, Stop here, a breakpoint - it is the T-states of that whole run;
the right one is the number of T-states since the start of the current frame, that is, since the last frame interrupt.
Tick Accumulate T to add the steps up: the left number keeps growing from step to step until you untick it. Ticking it starts the count again from 0.
The count is the real time on the machine, with memory contention and the interrupts that came in between.
Examples
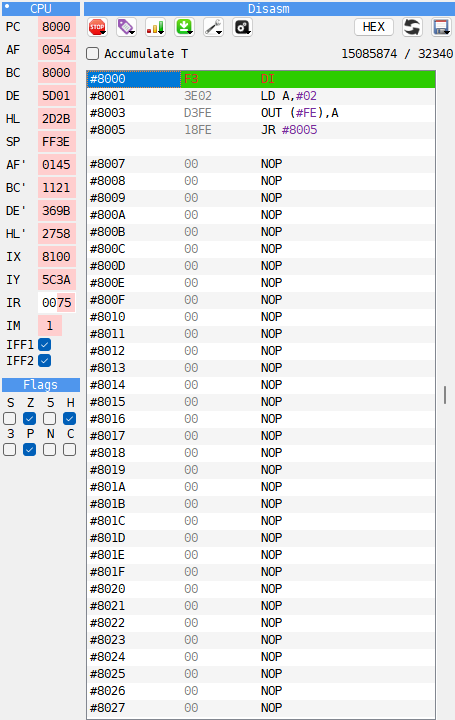
Stop at the start of a loaded program and step through it
A program on tape usually loads a code block and starts it at its first byte. The
Info column of the Tape Player shows where a code block loads, for example
CODE 32768,6912: the program starts at 32768, which is 8000 in hex.
Mount the tape - do not run it (see Run a program).
Open the Debugger. Click the listing, press G, type
8000and press Enter. The listing shows address 8000 (see Typing an address).Press Space. The line gets a breakpoint, shown in the Break color.
Press Esc. The machine runs.
Load the tape:
LOAD ""in 48K BASIC, or Tape Loader in the 128K menu.When the loader jumps to the program, the Debugger opens with the first instruction at 8000 marked as PC. Nothing of the program has run yet.
Press F7 to run one instruction at a time and watch the registers change. Press F8 on a CALL to run the whole subroutine at once.
The breakpoint stays and stops the machine there again the next time. Press Space on the line again to remove it.
Count the T-states of a routine
Stop the machine on a CALL of the routine, with a breakpoint or by stepping to it.
Make sure Accumulate T is not ticked.
Press F8 (Step over). The routine runs at full speed, and the Debugger opens again on the line after the CALL.
The left number of the T-state counter is the time the CALL took, the routine and its RET included.
To time a part of a routine instead, step to where the part begins, click the line where it ends and press Stop here: F4 (Modern), F9 (Classic).
To add up a few instructions, tick Accumulate T - the left number starts from 0 - and press F7 for each one. The left number is their sum.
