Breakpoints panel
A breakpoint tells the machine to stop at a place or on an event: when the CPU runs an instruction at an address, reads or writes a memory cell, uses a port, gets an interrupt, or when an expression comes true. Instead of stopping, a breakpoint can also count its hits, save the screen or write a line to the breakpoint log, and two of them can time the code between them. The Watcher window and the watched ports show values while the machine runs.
Breakpoints work while the machine runs. A step taken in the Debugger does not stop on a breakpoint (see Running and stepping).
Kinds of breakpoint
Kind |
Stops when |
|---|---|
CPU address |
the CPU uses an address, whatever memory page is there |
I/O port |
the CPU reads or writes a port |
RAM cell |
the CPU uses a byte of RAM, wherever that page is mapped |
ROM cell |
the CPU uses a byte of ROM, wherever that page is mapped |
Slot cell |
the CPU uses a byte of the cartridge |
divMMC cell |
the CPU uses a byte of a divMMC’s ROM or RAM, wherever that page is mapped |
Interrupt |
the CPU takes an interrupt: an NMI, or an INT while interrupts are enabled |
Condition (global) |
an expression comes true; no address |
A memory breakpoint has three flags, and any number of them can be on. They follow the Z80’s own bus cycles:
Fetch - the CPU fetches the byte as an opcode to run it: the first byte of an instruction, or a prefix byte after it, such as the
CBofDD CB d opor the byte afterED. The machine stops before the instruction runs, with it under the cursor in the listing. A HALT stops once, not again on every cycle the CPU waits in it. When the CPU takes an interrupt instead of the instruction, the breakpoint waits for the instruction to run.Read - the CPU reads the byte in a memory read cycle: an operand, the
dand the last byte ofDD CB d op, data, a word popped from the stack, the vector of an IM 2 interrupt. Opcode fetches are not reads.Write - the CPU writes the byte.
A port breakpoint has Read (IN) and Write (OUT). A read, write or port breakpoint stops after the instruction that made the access has run to its end.
An Interrupt breakpoint stops the machine before the step in which the CPU takes the interrupt, with PC on the instruction it interrupts; the next step enters the handler. An interrupt request the CPU does not take - under DI, right after EI, or while the handler still runs with interrupts off - does not stop it.
Breakpoints see the CPU of the machine and nothing else. They miss memory changed by a DMA (the ZX Spectrum Next’s, TSConf’s), by the General Sound’s own CPU, and by flash loading, which puts a tape’s bytes into memory without the CPU reading them.
CPU address and RAM cell differ on a machine that pages its memory. A breakpoint
on CPU address C000 stops the machine whatever page is at C000. A breakpoint on a RAM
cell stops only for that byte of that page, at whatever CPU address the page is mapped.
On a ZX Spectrum Next the pages of a RAM cell are its 8K pages, numbered as MEMMAP shows
them. The Next keeps its ROMs and divMMC in that same memory, so a RAM cell can also be one of
them: ROM0:0038, DIV3:0010, ALTROM1:..., DIVROM:..., MFROM:..., MFRAM:....
Its divMMC needs no divMMC cell.
Setting breakpoints from the listing
The quickest way is to press a key on a line of the Disasm listing. Each key switches its breakpoint on; the same key again switches it off. The keys are the same in both presets:
Key |
Breakpoint on the line under the cursor |
|---|---|
Space |
Fetch, on the memory cell |
Shift+Space |
Fetch, on the CPU address |
Ctrl+Space |
Write, on the memory cell |
Alt+Shift+Space |
Read, on the memory cell |
A line with a breakpoint is drawn in a different color. The keys can be changed on the Hotkeys page of Options, as Disasm: Breakpoint, Disasm: Breakpoint on read, Disasm: Breakpoint on write and Disasm: Breakpoint on CPU address (see Hotkeys page).
The  Breakpoints button over the listing has Fetch break, Read break
and Write break, and so has Breakpoints in the right-click menu of the listing.
They work on the selected block when the cursor is inside it, or else on the line under the
cursor, and make a memory cell breakpoint. To select a block, drag over the lines with the
left button.
In the memory dump, the right-click menu has Fetch break, Read break and Write break for the byte under the cursor (see DUMP panel).
Debugger: Stop here - F4 (Modern), F9 (Classic) - lets the machine run until it gets to the line under the cursor, without a breakpoint in the list (see Disasm panel).
The Breakpoints panel
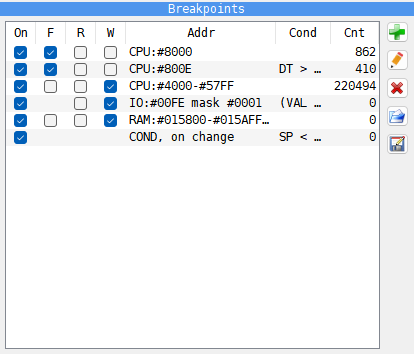
The list of breakpoints.
The buttons:
 add,
 edit,
 delete,
 open a list and
 save the list.
The Breakpoints panel is the tab with the stop sign under the memory dump. Each row is one breakpoint:
Column |
What it shows |
|---|---|
On |
a tick: the breakpoint works; no tick: it stays in the list but does nothing |
F, R, W |
the Fetch, Read and Write flags; a port has no F, an interrupt and a global condition have no flags |
Addr |
the kind and the address, see below |
Cond |
the condition |
Cnt |
how many times it fired |
Click a box in the first four columns to switch it on or off. Click a column title to sort the list by it.
Addr names the kind of breakpoint:
Text |
Kind |
|---|---|
|
CPU address, an address or a range |
|
I/O port, the port and its mask; in decimal |
|
RAM cell: the place in all of RAM, then the page and the offset in it |
|
ROM cell, Slot cell, divMMC cell, written the same way; a divMMC page is 8K, its ROM |
|
Interrupt |
|
Condition (global) |
Double-click a row of an address, RAM or ROM breakpoint to show that place in the listing; for a RAM or ROM cell this works only while its page is mapped in.
The buttons at the right:
- add (the plus sign) - opens the Breakpoint Editor for a new breakpoint;
- edit (the pencil) - opens the selected one in the Breakpoint Editor;
- delete (the red cross) - removes the selected breakpoints; Del in the
list does the same;
- open (the folder) - loads a list from a
.xbrkfile or abpx.ini, in place of the one you have; - save (the floppy with a pencil) - writes the list to a
.xbrkfile.
The right-click menu of the list has:
- Add breakpoint and Edit breakpoint - as the buttons;
- Delete breakpoint - removes the selected breakpoints, as the delete
button does;
 Reset counter - sets Cnt of the selected breakpoints back to 0,
and also clears the hit count that
HITSreads and what their spans measured;Open breakpoint log - opens the breakpoint log in the program your system opens
.logfiles with. It is grayed out until something is written to the log.
Hold the mouse over the row of a breakpoint that opens a span to see what the span measured (see Spans).
The list is not kept when the program closes. Save it to a file to use it again.
The Breakpoint Editor
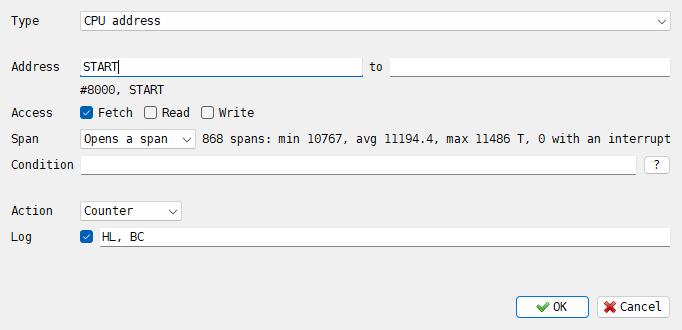
The editor shows only the fields the chosen Type needs. In the picture it holds a breakpoint that opens a span and logs two registers on every hit; the line beside Span is what the span has measured so far.
Field |
What it sets |
|---|---|
Type |
the kind: CPU address, I/O port, RAM cell, ROM cell, Slot cell, divMMC cell, Interrupt, Condition (global) |
Page |
the page of a cell, as a decimal number: 16K, but 8K for the Next’s RAM and for divMMC |
Address … to |
the first and the last byte; to left empty means one byte. For an I/O port they are Port and mask |
Access |
Fetch, Read, Write |
Span |
None, Opens a span or Closes a span, see Spans |
Condition |
an expression; the breakpoint fires only when it is not 0. Empty means always. On change beside it is for a global condition |
Action |
what happens when it fires: Debugger, Counter or Screen dump |
Log |
also write a line to the breakpoint log every time it fires, and what to write in it |
Addresses
The Address fields take a number - hex with a sign, #8000, $8000, 0x8000 or
8000h, decimal without one, 32768 - or a label name (see
Typing a number). A label takes priority over a number
written the same way: if there is a label BEEFh, BEEFh is that label and #BEEF the
number. Port takes a number the same way, but no label; its mask is bits, always
hex, with or without a sign.
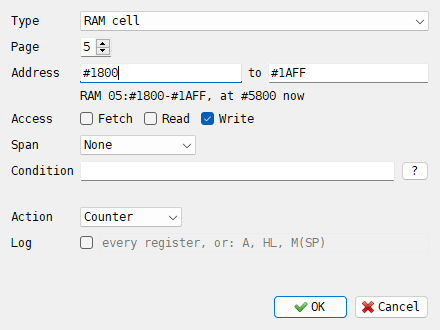
A cell of RAM, ROM or the slot can be given in four ways:
an offset in the page,
0000to3FFF(1FFFfor an 8K page), with the page in Page;the page and the offset together,
05:#1800. The page is hex here, while Page counts in decimal; the offset is a number as above, and a sign in front of the page counts for it too:#05:1800. Memory with a name of its own takes the name instead:ROM0:0038,DIV3:0010;a CPU address past the page size, such as
5800: the cell is the one mapped there now, and Page changes to that cell’s page. This works when the memory there is of the kind that Type names; otherwise the address is taken as an offset in Page;a label, which also sets Page.
The line under the fields shows how the address was read: 8000, START for a CPU address
with its label; RAM 05:1800-1AFF, at 5800 now for a cell, or not mapped now when its
page is not in the memory at the moment. When it cannot be read, the line says why in red,
such as the range ends before it starts or the end is in another page, and
 OK does not accept it.
The mask of a port says which bits of the 16-bit port address are compared: a 1 bit
must be the same as in Port, a 0 bit can be anything. Empty or FFFF is one exact
port; 00FF matches on the low byte; 0001 with port 00FE matches every even port, which
is every port the Spectrum’s ULA answers.
Condition and Log
The line under Condition checks the expression as you type it. It shows ok: and
the expression as it was understood, with brackets for the priorities and hex numbers with
0x; or what is wrong and at which character. OK does not accept a
broken condition. The ? button opens Expression Syntax, a short version of the
next section.
In the field beside Log, type what each logged hit writes: expressions split by
commas, such as A, HL, M(SP), in the syntax of a condition. When the field is empty, the
line has every register. With a wrong expression, OK keeps the editor open and shows
what is wrong under Condition.
Label names are completed as you type in the address fields, Condition and Log.
Cancel closes the editor and changes nothing. Editing a breakpoint keeps
its counters and what its span has measured.
Conditions
A condition is an expression in the style of C. It is checked when the breakpoint is hit; the breakpoint fires when the result is not 0. Comparisons and the logical operators give 1 for true and 0 for false.
Operators
From the one that binds tightest to the loosest; operators in one row have the same priority and work from left to right.
Operator |
Meaning |
|---|---|
|
brackets |
|
the word and the byte in memory at x |
|
logical not, invert all bits, negate |
|
the byte in memory at x+n |
|
multiply, divide, remainder |
|
add, subtract |
|
shift left, shift right |
|
compare |
|
equal, not equal; |
|
bitwise and |
|
bitwise exclusive or |
|
bitwise or |
|
logical and |
|
logical or |
The values are 32-bit numbers with no sign: -1 is FFFFFFFF, so A - 5 < 0 is never
true. Division by 0 gives 0, so a condition does not start firing when a divisor happens
to be 0. A word in memory is read low byte first, as the Z80 reads it.
Operands
Operand |
Meaning |
|---|---|
|
a CPU register, see below |
a name |
a label: its address |
|
a decimal number |
|
a hex number |
|
the code of a character |
|
the byte at x |
|
the word at x |
|
1 if the beam passed dot x of line y during this instruction |
The registers are A, F, B, C, D, E, H, L and the same with ' for the
second set (A', B'…); the pairs AF, BC, DE, HL, AF', BC', DE', HL';
IX, IY and their halves IXH, IXL, IYH, IYL; SP, PC, I, R, IR; IM,
IFF1, IFF2. Register names can be typed in either case; label names cannot.
A name is looked up first as a register, then as one of the variables below, then as a
label, and last as hex with an h behind, as C9h. So a label that has the name of a
register cannot be reached by its name.
A number without a sign is decimal: 100 is a hundred, 0x100, #100, $100 and 100h
are 256, and 0100 is a hundred too - a leading zero means nothing. A bare FF is
therefore not a number but a name, so hex always needs its sign. The rule is the one the
address fields have: see Typing a number.
Variables
These variables hold the last memory or port access of the instruction. Each is FFFFFFFF
when there was none.
Variable |
Meaning |
|---|---|
|
the address of the last memory read, as Read sees it: opcode fetches do not count |
|
the address of the last memory write |
|
the byte of that read or write |
|
the port of the last IN |
|
the port of the last OUT |
|
the byte of that IN or OUT |
The state of the machine:
Variable |
Meaning |
|---|---|
|
1 while the TR-DOS ROM is switched in |
|
the page in the memory window at |
|
frames since the last reset, as the FRAME counter of the MEMMAP panel |
|
where the beam is between two instructions, as the RAY counter of the MEMMAP panel |
|
how many times this breakpoint was hit, see below |
|
T-states since the span opened, or since the previous hit of this breakpoint, see Spans |
A port is 16 bits wide, and the Spectrum decodes only part of it. IN and OUT hold the
whole 16 bits, so test for the keyboard port as (IN & 0xFF) == 0xFE, not as one exact
value. When a program always uses the same full port, as 128K paging uses 7FFD, plain
OUT == 0x7FFD is enough.
RAYX and RAYY count dots and lines from the first visible one, borders included. The
line is longer than the picture, so a 48K frame is 448 x 312. Use them for a region of
the frame, for example RAYY == 100 && RAYX >= 200.
RAY(x, y) is for one exact dot. The beam moves 8 to 46 dots during one instruction, so
RAYX == 200 is almost never true between two instructions; RAY(200, 100) asks whether the
beam passed that dot while the instruction ran, and is true once a frame. The machine
stops right after that instruction. Both arguments can be expressions, such as
RAY(200 + B, RAYY). A plain number outside the frame is refused while you type it; a
computed one outside the frame is simply never reached.
Before or after the instruction
On a Fetch breakpoint the registers are read before the instruction runs. On a Read, Write or port breakpoint they are read after it.
HITS
On a breakpoint with an address, HITS counts every hit of it, this one included, whatever
the condition says. HITS > 30 lets the first 30 hits pass and stops on the 31st.
On a global condition there is no address to count, so HITS counts the times the
condition itself fired, this one included. It can limit a condition (HITS <= 3 stops the
first three times) but cannot skip hits: PC == 0x8000 && HITS > 30 never comes true, because HITS only
grows when the whole condition is true. To let an address pass a number of times, make it
an address breakpoint with the condition HITS > 30. The editor warns about this in amber.
DT
On a breakpoint that closes a span, DT is how long that span took, in T-states:
DT > 12000 in its condition fires only on a pass that ran too long. On any other
breakpoint with an address it is the time since the previous hit of the same breakpoint.
It is 0 when there is nothing to measure from, such as on the first hit, and on a global
condition.
Good to know
A place - the kind, the first and the last byte - holds one breakpoint, so it has one condition. Join several conditions with
||.Breakpoints whose bytes or ports overlap are separate, a CPU address and a cell on the same byte too: each one gets the hits on what it covers, with its own condition, counter and action, and one asking for the Debugger is enough to stop. A switched-off breakpoint takes nothing and hides nothing from the others.
A breakpoint is hit once per instruction, however many of its bytes the instruction uses: a Write on
FF44-FF45counts aPUSHthere once, and its log line names the first of the two writes.A condition that cannot be worked out when it runs, such as one with a label that is no longer loaded, fires, so the mistake does not go unnoticed.
Examples
Condition |
Fires when |
|---|---|
|
A is 5 and the word on top of the stack is above |
|
BC holds either value |
|
a HALT is about to run |
|
the stack ran down into the screen and system variables |
|
something writes to the screen’s pixels |
|
a key is pressed while the keyboard is read |
|
a 128K program pages RAM page 3 in at |
|
RAM page 7 is at |
|
on an address breakpoint: the 30th time it is hit |
|
as a global condition with On change: the first instruction of frame 300 |
|
every instruction on line 100; with On change, once a frame |
|
the instruction during which the beam passed dot 200 of line 100 |
|
on a breakpoint that closes a span: the span took more than 12000 T |
Global conditions and On change
A breakpoint of type Condition (global) has no address. Its expression is checked
after every instruction, so it finds things no single address can: “A became 0 somewhere”,
“the stack went below 5B00”.
By default it fires on every instruction while the expression is true, just as the
condition of an address breakpoint does. Tick On change to make it fire only when the
expression becomes true: once, and again only after it was false in between. A == 0
without On change stops on every instruction while A stays 0; with On change, only
on the instruction that made A 0.
Several global conditions can come true on the same instruction; each one then does its own action.
Actions
Action |
What happens |
|---|---|
Debugger |
the machine stops and the Debugger opens |
Counter |
the machine keeps running; only Cnt in the list grows |
Screen dump |
the machine keeps running; the 6912 bytes of the screen shown (RAM page 5, or 7 for the second screen) are saved as an |
A screen dump goes into the screenshots folder (the Output of the Screenshots group
on the Video page of Options, see Screenshots), named as
a screenshot is, such as xpeccy-plus_20261110_153012_Tetris GB_001.scr.
Spans
Two breakpoints can time the code between them. Set Span of the first to Opens a span and of the second to Closes a span. Each time the machine gets to the first and then to the second, the T-states between them make one span. The opening breakpoint stores how many spans there were, the shortest, the average and the longest, and how many of them had an interrupt in the middle.
The span is opened and closed on every hit, whatever the condition says. The condition and the action decide only whether the hit stops, counts or logs.
A closing breakpoint closes the span opened last, whichever breakpoint opened it. So spans can nest: a routine called from a timed routine can be timed too, each on its own.
A closing breakpoint with no span open measures nothing.
A routine with several ways out needs a closing breakpoint on each of them.
Any breakpoint with an address can open or close a span, and so can Interrupt; a global condition cannot.
What the spans measured is shown:
beside Span in the Breakpoint Editor, for an opening breakpoint;
when you hold the mouse over its row in the Breakpoints panel, such as
938 spans: min 10767, avg 11193.0, max 11486 T, 0 with an interrupt;at the end of the breakpoint log, when the program closes, if a breakpoint wrote to it, and at the end of a run with no window: one line for each opening breakpoint.
SPAN START n=10 min=10767 avg=11211.6 max=11487 sum=112116 int=0
The line has the breakpoint’s label, or its address when it has none, then the number of spans, the shortest, the average and the longest in T-states, their sum, and how many had an interrupt.
Spans of the same code differ for a reason: on a Spectrum the CPU waits when it uses the memory the screen is read from at that moment, so the same loop takes longer while the beam draws the picture. Reset counter in the right-click menu of the list clears them.
The breakpoint log
Tick Log in the Breakpoint Editor and every time the breakpoint fires, a line goes to the breakpoint log, whatever its action is. With the action Counter this logs every hit without stopping.
The log is a file of its own. The file is created at the first logged hit, with nothing
else to switch on: xpeccy-plus-<date>-<time>-brk.log, in logs/<date>/ beside the
program, or in the Folder of the Log group on the Application page of
Options. If that folder cannot be written to, the log goes to the settings folder.
Open breakpoint log in the right-click menu of the Breakpoints list opens it; --brk-log on the command line
sends it elsewhere (see Command line).
Apart from the date in its first line, the log has no time of day in it, only the machine’s own time. Two runs of the same program give the same lines, so two logs can be compared line by line.
# Xpeccy+ 2026.8 breakpoint log, 2026-10-11 20:46:19
# F frame, T since its interrupt, t since the machine was made, all in T
F00000000 T034459 t=5758 CPU:8006 RAM:02:0006 F n=1/129 stop DT=42 cond=HL == 0x4080 PC=8006 AF=8080 BC=0080 DE=FFFF HL=4080 SP=FFFF AF'=FFFF BC'=FFFF DE'=FFFF HL'=FFFF IX=FFFF IY=FFFF IR=0002 IM=0 IFF1=0 IFF2=0 F=S------- ROMPG=0 RAMPG=0 DOS=0 ROM=1 CPM=0 INT=0
Part |
Meaning |
|---|---|
|
the frame since the last reset, and the T-state in it |
|
T-states since the machine was made |
|
where it fired: the breakpoint’s own address, then the same place written the other way - page and offset for a CPU address, the CPU address for a cell |
|
what was done there: |
|
how many times it fired, and how many times it was hit |
|
the action is Debugger: the machine stopped here |
|
the breakpoint opens or closes a span; a close names the breakpoint that opened it and how many interrupts came in between |
|
the value of |
|
the condition, when there is one |
|
the registers; PC is the instruction the breakpoint belongs to |
|
the flags, by letter: S, Z, 5, H, 3, P, N, C |
|
the ROM page at |
|
the signals of the MEMMAP panel |
With expressions in the field beside Log, the line has them in place of the registers, each as written and its value in hex:
F00000000 T040188 t=11487 CPU:800E RAM:02:000E F n=1/1 span=close from=START int=0 DT=11487 HL=4100 BC=0000 M(0x4000)=FF
An expression that cannot be worked out at that moment is written as ?.
Breakpoint files
Save in the Breakpoints panel writes the list to a text file,
.xbrk; Open loads one, in place of the list you have. A file can be
written by hand too: one breakpoint a line, its fields split by colons. Lines starting with
; are skipped. Open takes a bpx.ini too: its lines x0=0x8000, r0=... and
w0=..., an address or a range, become address breakpoints on fetch, read and write.
; Xpeccy+ Debugger breakpoints list
CPU:8000::F:DBG:
CPU:4000-5AFF::W:DBG:
IO:00FE:0001:W:DBG:(VAL & 7) == 2
RAM:05:0000-1AFF:W:CNT:
ROM:00:0038:FL:CNT:
COND:::E:DBG:SP < 0x5B00
CPU:START::FL[:CNT::HL, BC
CPU:DONE::F]:DBG:DT > 11400
Field |
What it holds |
|---|---|
1, kind |
|
2 |
|
3 |
|
4, flags |
any of |
5, action |
|
6, condition |
the condition, or empty |
7, log |
what a logged hit writes: expressions split by commas. Leave it out for every register |
A line can stop after the condition; the last two fields can be empty.
An address in a list is hex without a prefix, as Save writes it, or a label of the
labels loaded at the time: CPU:START, CPU:START-DONE. A label takes priority over hex
written the same way; #, $ or 0x in front makes it a number. A label carries its
page, so the page field can be left empty: RAM::SCREEN_BUF:W:CNT:. On the Next a RAM page
is 8K, as in the editor. A CPU line with a label that is not paged in when the list is
loaded, or with a ROM name of several systems, gets cell breakpoints where the label runs, as
--bp does: CPU:LD_BYTES on a +3 is a ROM cell in ROM 1 and one in ROM 3. Save
writes the addresses as numbers.
A line that cannot be read is left out and named in the log. A condition or a log
expression that does not compile is kept as it is: the condition then fires every time, and
the expression is written as ?, so the mistake shows. A line the list already holds word
for word is left out, so a list loaded twice counts each hit once.
Options of the command line set breakpoints at start (see Command line):
--bp ADR- a Fetch breakpoint on a CPU address or a label; a label in a page that is not paged in at start gets a cell breakpoint instead (ROM cell, RAM cell…), one in each bank a ROM label’s name is in;--brk FILE- loads a.xbrkfile; its breakpoints are added to those loaded before;--brk-log FILE- writes the breakpoint log to that file, or with-to the standard output.
The labels given with -l are loaded first, wherever -l stands on the command line.
Together with --bench, these options run a test from a script with no window; the run ends
on the first breakpoint with the action Debugger (see
Running with no window).
Examples
Stop when the program writes to the screen
In the Breakpoints panel, press
add (the plus sign). The editor opens on
a CPU address with Fetch ticked.Untick Fetch, tick Write.
Type
4000into Address and5AFFinto to. The line under them says4000-5AFF.Press
OK and close the Debugger.
The row says CPU:4000-5AFF with a tick under W. The first time anything writes to the
screen, the Debugger opens. The machine stops after the instruction that wrote; in the
listing it is usually the line above the cursor.
Stop when the border color changes
The border color is set by an OUT to the ULA’s port, FE.
In the Breakpoints panel, press
add.Set Type to I/O port.
Tick Write.
Type
00FEinto Port and0001into mask, so every even port counts, as on the real machine.Press
OK and close the Debugger.
The row says IO:00FE mask 0001. The Debugger opens on every OUT to the port. A program
that makes sound writes the same port all the time, for the speaker; to stop only when the
border turns red, put (VAL & 7) == 2 into Condition.
Log every call to a routine without stopping
In the Debugger, put the cursor on the first line of the routine and press Shift+Space.
Select the new row in the Breakpoints panel and press
edit (the pencil).Set Action to Counter and tick Log. To log only some values, type them into the field beside it, such as
A, HL, M(HL). Press OK.Close the Debugger.
The machine runs on as before. Cnt in the list counts the calls, and every call adds a line to the breakpoint log. Open breakpoint log in the right-click menu of the list shows it.
Stop when A is 0 at a given address
Put the cursor on the line in the listing and press Shift+Space.
Select the new row in the Breakpoints panel and press
edit.Type
A == 0into Condition. The line under it says ok: (A == 0).Press
OK and close the Debugger.
The Cond column shows A == 0. The machine runs through that line as long as A is not
0, and stops on it, before the instruction runs, the first time A is 0 there.
Stop on the 50th pass
Make a breakpoint on the line as above.
Put
HITS == 50into its Condition.
The machine stops the 50th time the CPU gets to the line. Reset counter in the right-click menu of the list starts the count again.
Time a routine
Here the routine starts at the label START, and DONE is the last instruction of one
pass.
In the Breakpoints panel, press
add. Type STARTinto Address; the line under it says8000, START. Set Span to Opens a span and Action to Counter. Press OK.Press add again. Type
DONEinto Address, set Span to Closes a span and Action to Counter. Press OK.Close the Debugger and let the program run for a while.
Open the Debugger and hold the mouse over
CPU:8000in the list.
The tooltip says how many passes there were and how long they took:
938 spans: min 10767, avg 11193.0, max 11486 T, 0 with an interrupt.
To stop on a pass that is too slow, open the DONE breakpoint again, set Action to
Debugger and type DT > 11400 into Condition. The machine stops at the end of such a
pass.
Check a program from a script
The same two breakpoints, as a file timing.xbrk, with the labels of the program in
timing.lab. The closing breakpoint also writes HL and BC to the log:
CPU:START::F[:CNT:
CPU:DONE::FL]:CNT::HL, BC
xpeccy-plus -m zx48 -l timing.lab --brk timing.xbrk --brk-log - -a 0x8000 -f timing.bin --pc 0x8000 --bench 2
The machine runs two frames with no window. With --brk-log - the log goes to the
standard output, before the speed line and the spans:
# Xpeccy+ 2026.8 breakpoint log, 2026-10-11 20:41:36
# F frame, T since its interrupt, t since the machine was made, all in T
F00000000 T040188 t=11487 CPU:800E RAM:02:000E F n=1/1 span=close from=START int=0 DT=11487 HL=4100 BC=0000
F00000000 T051676 t=22975 CPU:800E RAM:02:000E F n=2/2 span=close from=START int=0 DT=11476 HL=4100 BC=0000
...
bench: machine zx48, fast, 2 frames in 0.005 s: 407.0 fps, x8.13 real time, 43.55 ns/T
SPAN START n=10 min=10767 avg=11211.6 max=11487 sum=112116 int=0
The exit code is 0. With the action Debugger and DT > 11400 on DONE, the run would
stop on the first slow pass and exit with 2, so a script can tell a slow build of the program
from a fast one.